
 Plugin
PluginUpdated
Graphs & Charts for Elementor
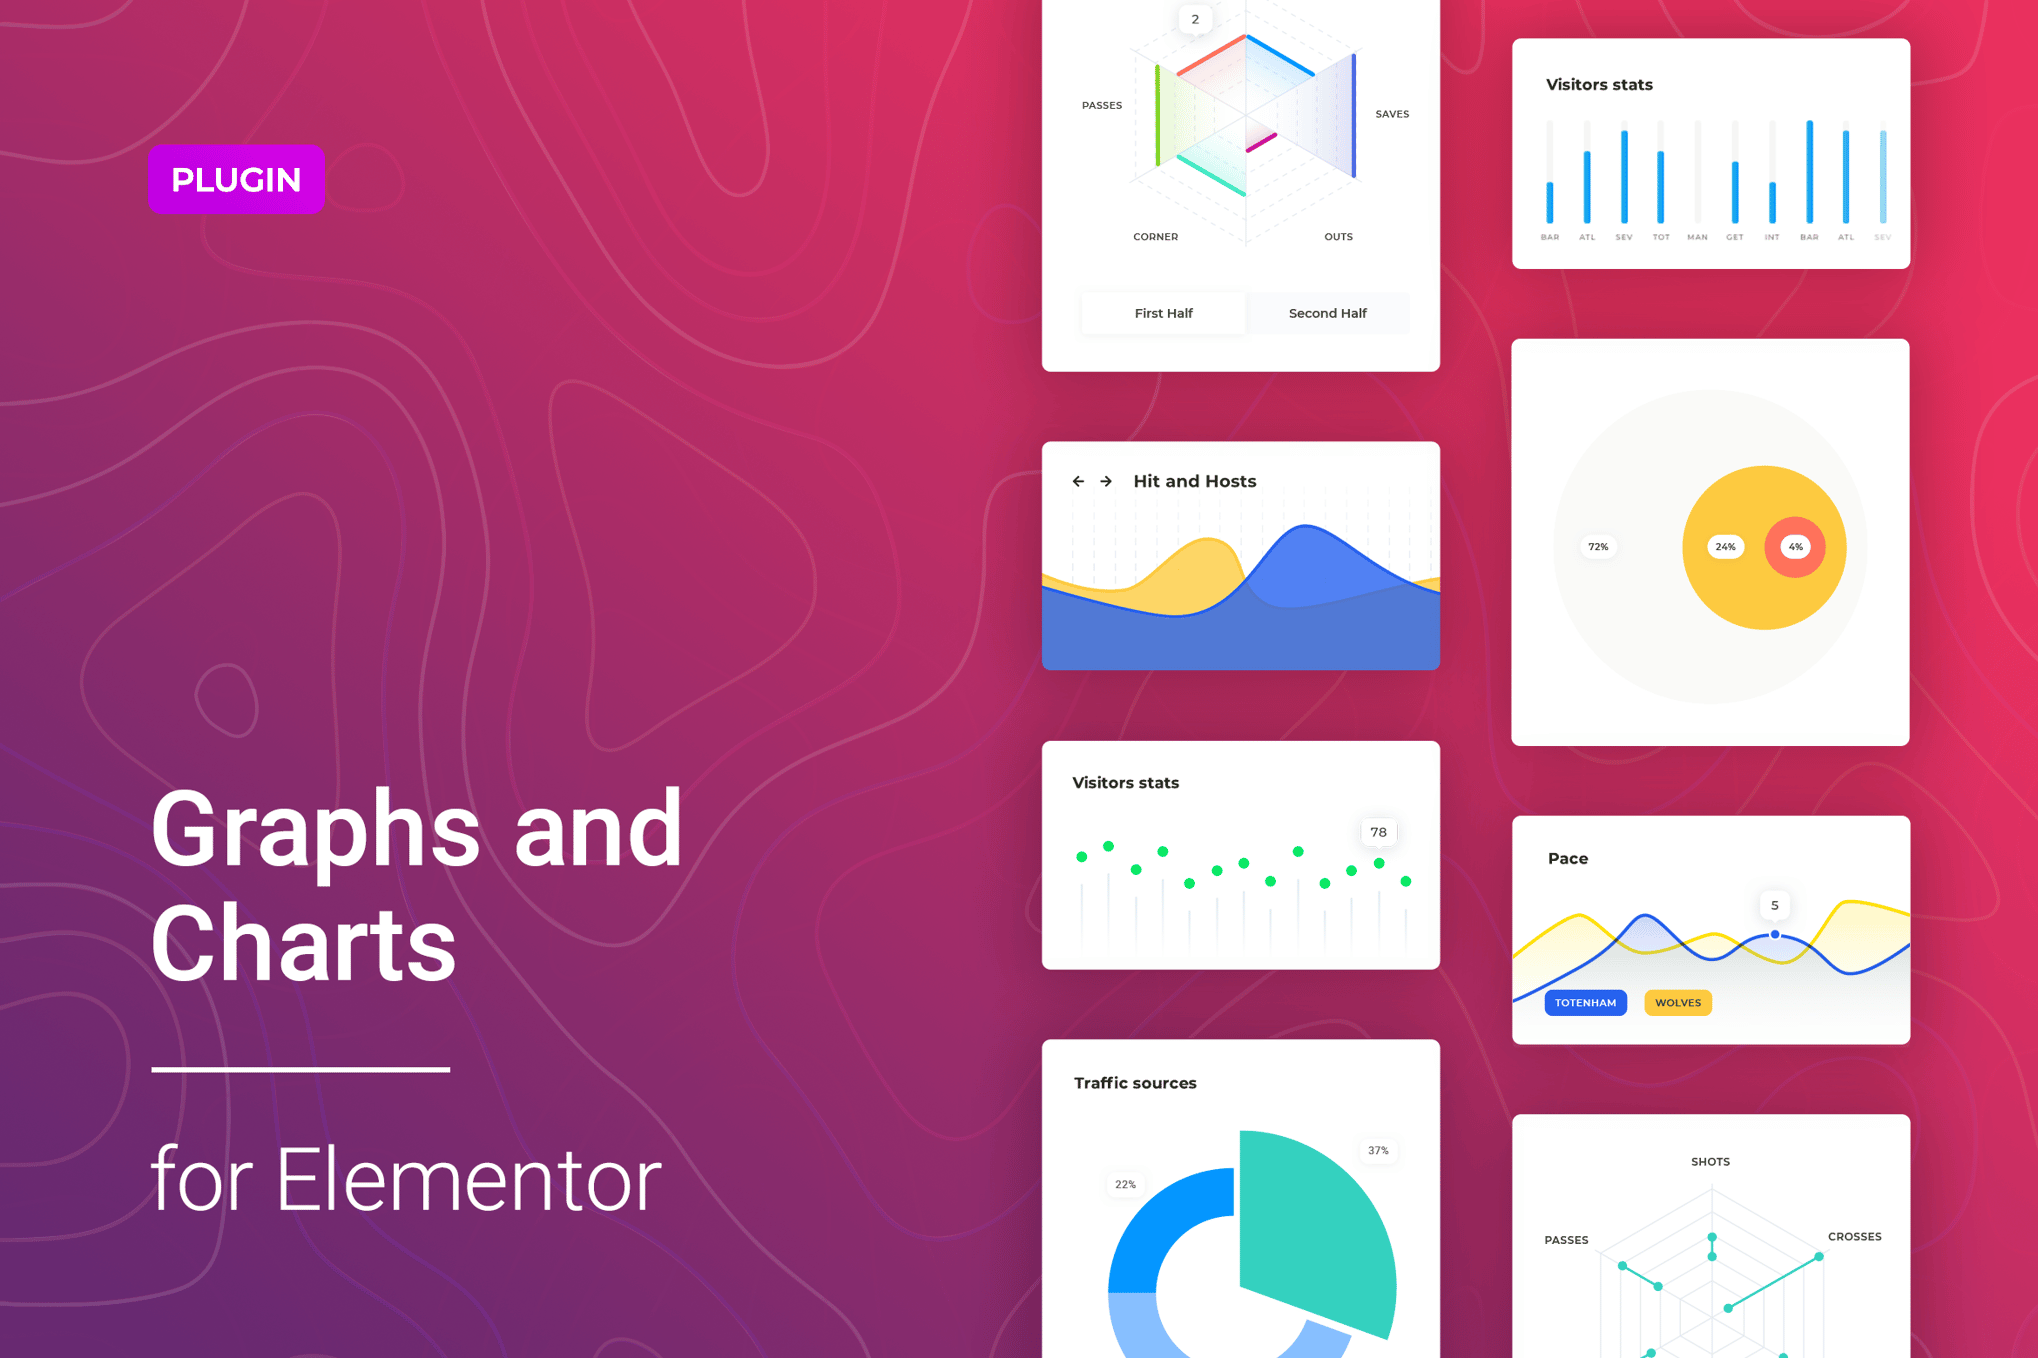
Graphs & Charts for Elementor is a WordPress plugin that adds chart widgets to the Elementor page builder.
Product facts
- Version
- 1.2.11
- Released
- 22 June 2026
- Type
- Plugin
- Licence
- GPL
- Included in
- Every plan, or $3.49 on its own
Overview
Numbers in a table are hard to read at a glance. This plugin gives Elementor users a way to turn business reports, financial statistics and performance metrics into charts that visitors can understand quickly. You add a chart widget to a page, enter your data and adjust the look to suit your design, with no coding needed.
The charts are responsive and retina ready, so they adapt to desktop, tablet and mobile screens. Because the plugin runs inside the Elementor editor, it fits corporate sites, blogs and online stores that already use Elementor. Both beginners and experienced builders can work with its simple data interface and styling controls.
Features
- Many chart types: Choose from line, bar, pie, donut, gauge and area charts, so you can match the visualization to the kind of data you want to present.
- Built on Chartist.js: The plugin uses the Chartist.js library, which supplies animations and detailed styling options for the charts you place on your pages.
- Works inside Elementor: Add and adjust charts in the Elementor drag-and-drop editor. No coding skills are required to place a chart and set it up.
- Responsive and retina ready: Charts adapt to different screen sizes and resolutions, so they display properly on desktops, tablets and mobile devices.
- Advanced chart options: Create more complex presentations with multi-line, stacked bar, bi-polar line and holes charts when a simple chart is not enough for your dataset.
- Simple data input: A straightforward data management interface lets you update chart values quickly, which suits reports and statistics that change often.
- Customizable styling: Adjust colors, fonts, sizes and animations so each chart matches your site's branding and overall design style.
Best for
- Elementor sites that publish reports or statistics
- Corporate sites, blogs and online stores sharing data
- Freelancers and agencies building client sites in Elementor
Changelog
Version 1.2.11 — 25 February 2026
- Security Fixed plugin security issues
Earlier versions
- 1.2.7 (9 August 2024): 1 improved
FAQ
Is Graphs & Charts for Elementor free?
The code of Graphs & Charts for Elementor is licensed under the GPL, so anyone may use, change and share it. Buy GPL is a paid service: a plan or a purchase of Graphs & Charts for Elementor gives you the download and its updates. The developer's own support, licence key and online services are not included.
Which version of Graphs & Charts for Elementor is this?
Version 1.2.11, released 22 June 2026. New versions appear here when the developer publishes them.
How do I update Graphs & Charts for Elementor?
Install Buy GPL Updater on your site and paste your key from My Account. It installs new versions of Graphs & Charts for Elementor for you.
You might also like
Plugin Plugin
 Plugin
 Plugin
 Plugin
 Plugin
 Plugin
 Plugin